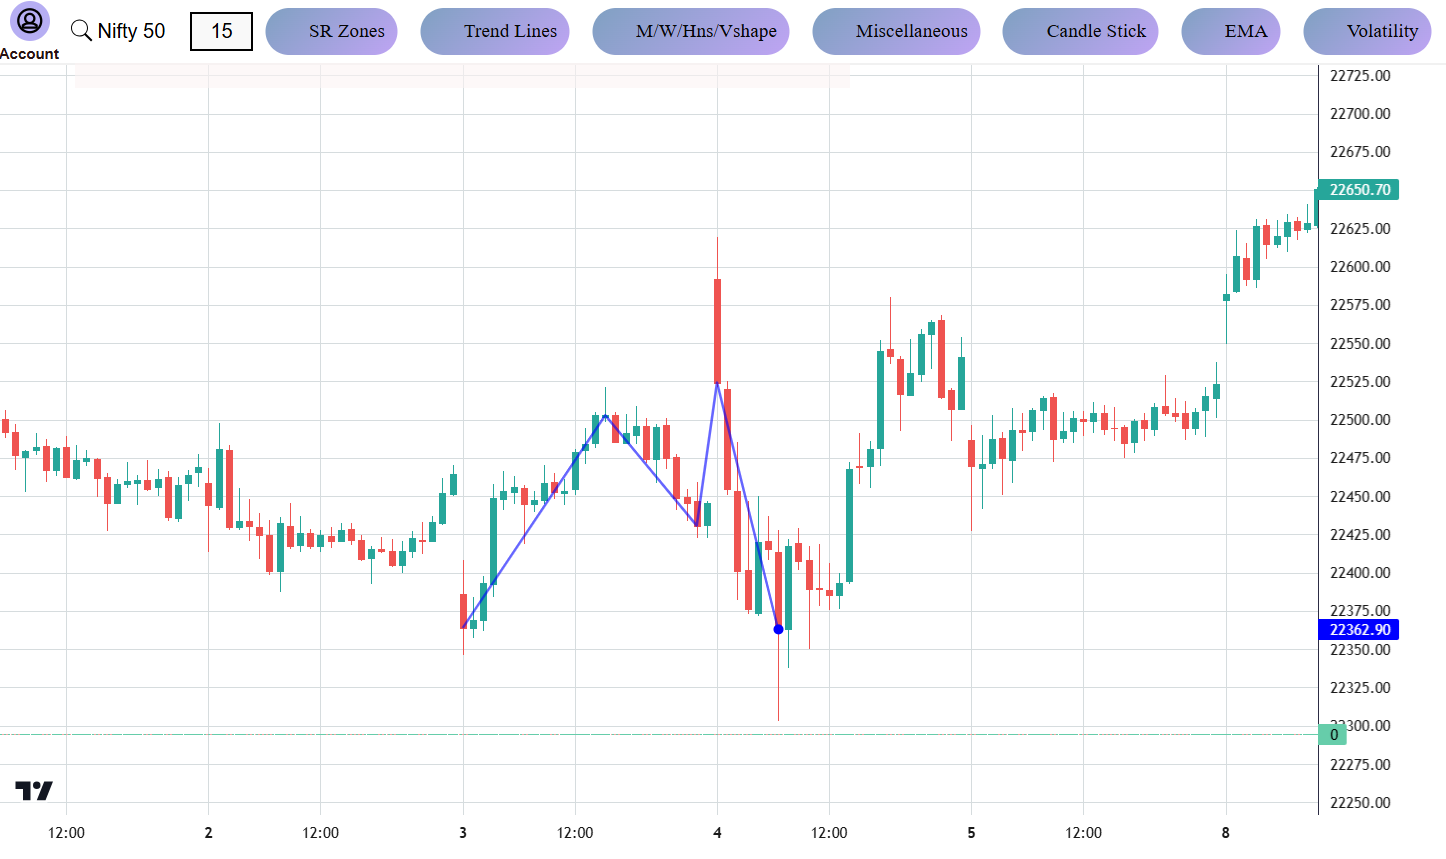
Double Top
Description:
- Double Top: Double Tops are bearish reversal patterns often seen in stock charts, signaling a potential downward trend after hitting a peak twice.
- For example, if a stock like Apple reaches $150 twice but fails to break above it, forming a "double top," traders might anticipate a drop in price once the stock breaks below the support level, say $140. This indicates weakening bullish momentum and the potential start of a bearish trend.
Impact on Price: After breaking the support (double top) or resistance (double bottom), the price tends to continue in the breakout direction.
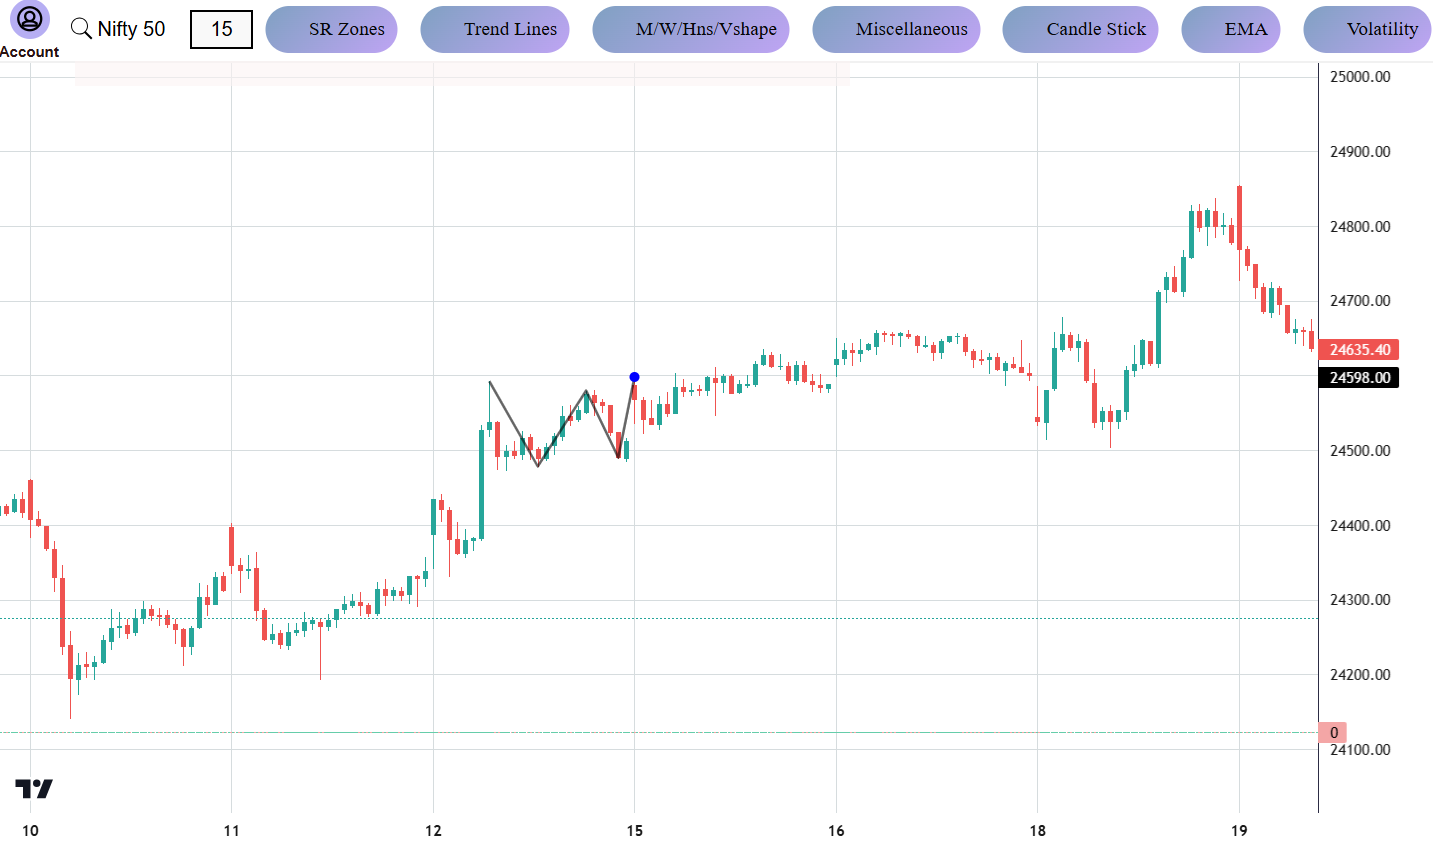
Double Bottom
Description:
- Double Bottom: , on the other hand, are bullish reversal patterns that occur when a stock hits a low point twice, indicating strong support.
- example is seen in a company like Tesla, where its price drops to $600 twice, but a breakout above a resistance level at $650 suggests a strong recovery and the start of a new bullish trend. This pattern is often used to identify buying opportunities as the market sentiment shifts upward.
Impact on Price: After breaking the support (double top) or resistance (double bottom), the price tends to continue in the breakout direction.