Head and Shoulders
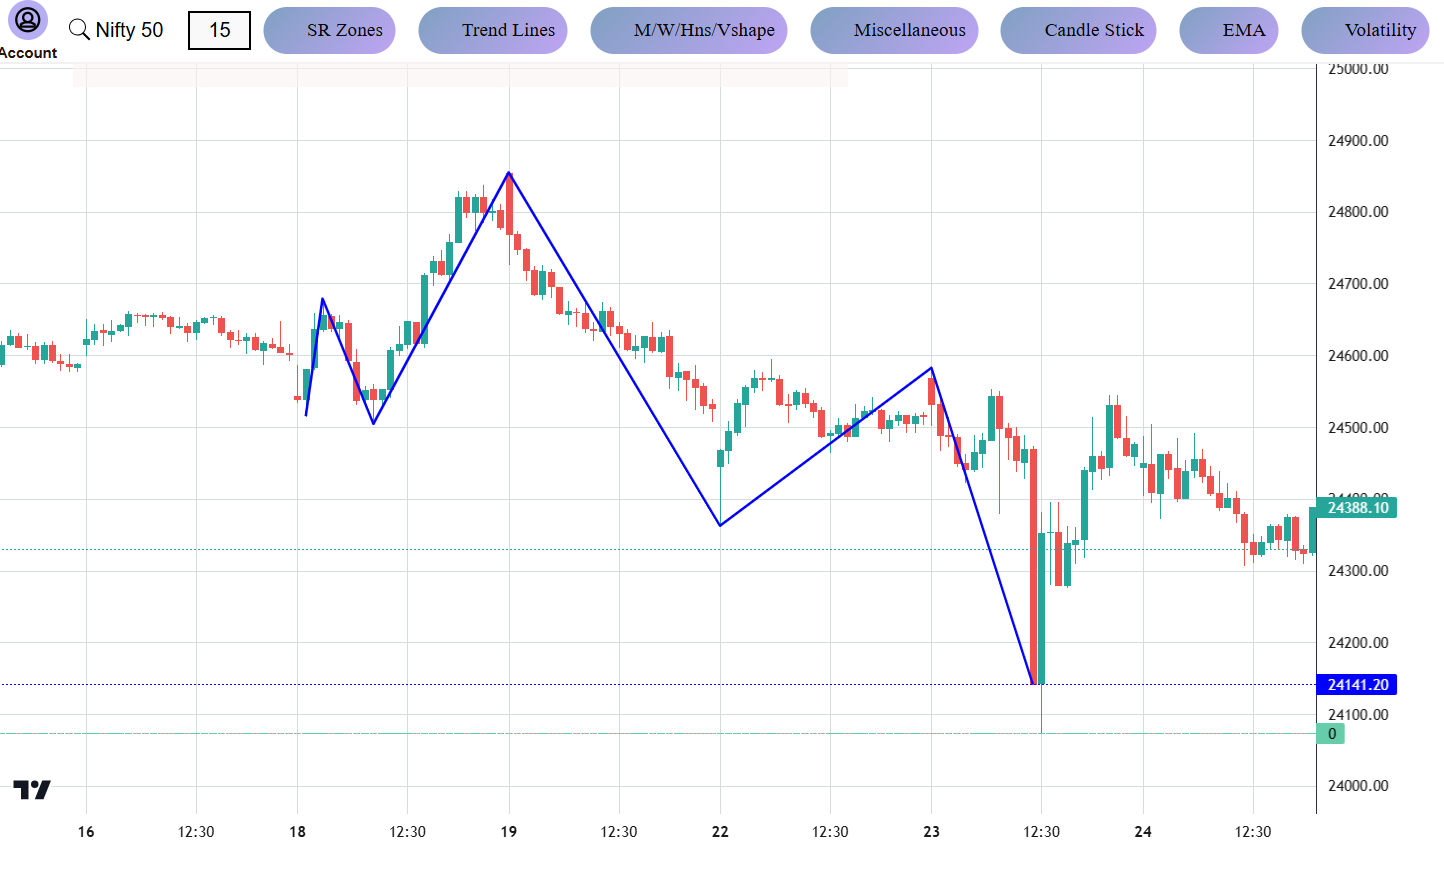
Head and Shoulders Pattern:The Head and Shoulders pattern is a classical chart formation used in technical analysis to predict trend reversals. Appearing after an uptrend, this pattern consists of three peaks: a higher peak (head) flanked by two lower peaks (shoulders). The pattern is completed when the price breaks below the neckline, which is drawn horizontally through the lows of the two troughs between the shoulders.
Impact on Price:
- Upon completion of the Head and Shoulders pattern, the market typically undergoes a significant bearish reversal. The breach of the neckline serves as a confirmation of this reversal, signaling that the bullish trend has exhausted itself and a downtrend is imminent.
- Traders interpret this pattern as an indication to sell or short the asset, anticipating a decline in price. This pattern's effectiveness lies in its ability to highlight a shift in market sentiment from bullish to bearish, often resulting in a notable price drop.
Inverse Head and Shoulders
Inverse Head and Shoulders Pattern:The Inverse Head and Shoulders pattern is a reversal chart formation that appears after a downtrend, suggesting a bullish turnaround. This pattern mirrors the Head and Shoulders pattern but in reverse. It features three troughs: the central trough (head) is the deepest, flanked by two shallower troughs (shoulders). The pattern is confirmed when the price rises above the neckline, a horizontal line drawn through the peaks between the shoulders.
Impact on Price:
- Following the completion of the Inverse Head and Shoulders pattern, the market is likely to experience a bullish reversal. The breakout above the neckline indicates a shift from bearish to bullish sentiment, signaling that the previous downtrend is ending and an uptrend is beginning.
- Traders view this pattern as a signal to buy or go long on the asset, anticipating a rise in price. The Inverse Head and Shoulders pattern is valued for its ability to highlight potential opportunities for profit as the market transitions from a downtrend to an uptrend.